AI-Driven Ad Cue Detection


.jpg)
Advertising is a primary revenue driver for streaming platforms. However, not all ad placements are equal. Ads inserted mid-dialogue or during emotionally intense scenes can frustrate viewers, disrupt immersion, and reduce engagement. This work addresses the problem of intelligent ad placement: by detecting natural scene change points in a video, such as a shift in location or a gap in conversation. Traditionally, identifying these boundaries has relied on human editors reviewing hours of footage, making the process expensive, time-consuming, and difficult to scale as content libraries continue to grow. To solve this, we developed an unsupervised machine learning approach that detects natural scene boundaries directly from video and audio signals. The result is a scalable, automated system that places ads where they feel natural, delivering an immersive viewing experience.
Different platforms determine ad placement positions using one of the three methods:
- Fixed interval scheduling
- Manual tagging
- ML based approach
In fixed interval scheduling the ads are placed every N (let’s say 10) minutes. This guarantees that more often than not the ad will be played in the middle of a story. In the manual tagging method, a human annotator must go through the video and mark the scene change points, which are then used for ad placement. Though this guarantees a better viewing experience, the method is costly and highly unscalable for the growing video libraries. Thus, an ML based solution to find scene change points offers a scalable, cost-effective and accurate alternative. Last year, Youtube introduced automated tagging for ads on all videos uploaded on the platform, resulting in a 5% increase in their revenue [1].
Two-step strategy for placing ads
A supervised ML based solution requires a large volume of annotated content. Such datasets are often not publicly available and are subject to significant noise due to annotator bias, and pinning an exact timestamp of a scene change is non-trivial. Hence, we took an unsupervised approach by decomposing the problem of ad placement into two parts. First, we detect all possible scene change time points in the video. Then, we score each detected boundary and select the K best boundaries out of all detected time points. Selection depends on two factors:
- Number of ad breaks the streaming platform wants to play in the content (K)
- Minimum time in minutes between consecutive ads breaks (M)
In the first part, focused on detecting scene change points, we want to optimize for recall (coverage). That is, we want to detect as many candidate scene boundaries as possible. The second part focuses on optimising for precision and applying business rules. This ensures we have the right number of ads, in the most natural spots, and that they are appropriately spaced.
Figure 1 shows the end-to-end pipeline that takes video as input and outputs the K scene boundaries. Each step of the process is detailed in the sections that follow.
.png)
Extracting all possible scene boundaries
In order to extract all possible scene boundaries in the video, we first segment the video into smaller chunks called shots. A shot is a continuous recording of a video from a single camera without any cuts. Generally, shots are 3-5 seconds long. Shots are detected by computing the pixel differences between consecutive frames. You can see this logic unfold in Animation 1 illustrated below.
Animation 1: Shot detection - When a camera cuts to a new angle, this difference spikes - that’s a shot boundary
Before moving to the scene detection logic, let’s define what a scene is. A video can be thought of as a collection of entities such as frames, shots or scenes. Frames are the fundamental units of a video; a shot is a collection of frames taken from one camera at an angle; and a scene is a collection of shots depicting a story. Thus, to detect scenes, we need to group similar shots together.
.png)
Defining embeddings and similarity between them
Frames and audio of a shot are passed through vision and audio models to represent them as embedding vectors. The vision model captures the visual content of images and videos - encoding objects, patterns and spatial relationships to represent the events occurring within a shot. The audio model captures the dialogue, music, and background sound effects. Each shot is thus represented as a set of embedding vectors. When two shots belong to the same scene, their embeddings are closer in the embedding space. This is illustrated in Animation 2 below.
Animation 2: Embedding visualization - The graph on the left tracks a 2D PCA representation of the video frame embedding in real-time. Observe how the shots from the first scene tightly group together. The exact moment the video crosses a narrative scene boundary, the trajectory abruptly shifts across the graph to form a distinct cluster
Similar shots in a scene form a cluster
The above animation reveals that the distance between the embedding vectors belonging to two shots of the same scene is significantly smaller compared to when shots do not belong to the same scene. A distance matrix that measures pairwise distances between all the shots also shows a similar pattern. Figure 3, which shows the pairwise distances, reveals a boundary line and a distinct pattern across four quadrants.
.png)
Q1 in the top left corner has low distances; thus, shots within it belong to same scene
Q4 in the bottom right corner, similarly has low distances; thus, shots within it belong to same scene
Q2 in the top right corner which measures the distance between the shots from one scene to the next has high distances
The scene change point is thus a point such that all shots before it have low distances, as do all shots after it, but the shots before and after that point have high distances. In the first part, where we aim to detect all possible scene boundaries in a video, we achieve this by finding such points in the distance matrix. We use the Optimal Sequential Grouping (OSG) algorithm [2] to group low-distance shots together and find scene change points like the one described above.
Optimal sequential grouping to find scene change points
The OSG algorithm works by evaluating each shot for a boundary. To achieve this, it calculates a cost for each proposed boundary. The cost measures how well the shots on either side of the boundary group together. High costs mean the scenes are disjointed or bleeding into each other. A low cost means that a shot is a scene change point. OSG uses a dynamic programming approach to find the time points minimising the cost. This search is illustrated in Animation 3. In a typical ten minute video chunk, we detect 6-8 scene change points; thus, for two hours of content, we obtain approximately 60-80 scene change points.
Animation 3: Optimal sequential grouping algorithm - As the proposed boundary line slides diagonally across the matrix, the algorithm calculates the cost of splitting the scenes at that specific shot. The algorithm identifies for the deepest dip in the curve—representing the exact scene change point where the block of similar shots on the left ends and a new scene begins on the right
Selection of the best scene change points
The second step of our approach is to apply business logic to select the K best scene change points for the ads that are at least M minutes far apart. Both K and M are inputs and can be selected by the user according to their ad requirements.
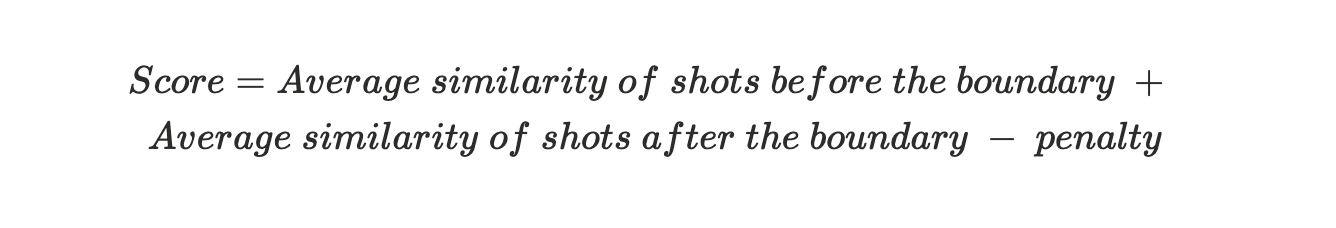
We select the best results by first assigning a score based on the quality of the scene boundary. For example, as shown in the Figure 4 below, if the shots before and after the boundary are highly similar but completely distinct from one another, it gets a high score—signalling a natural pause.
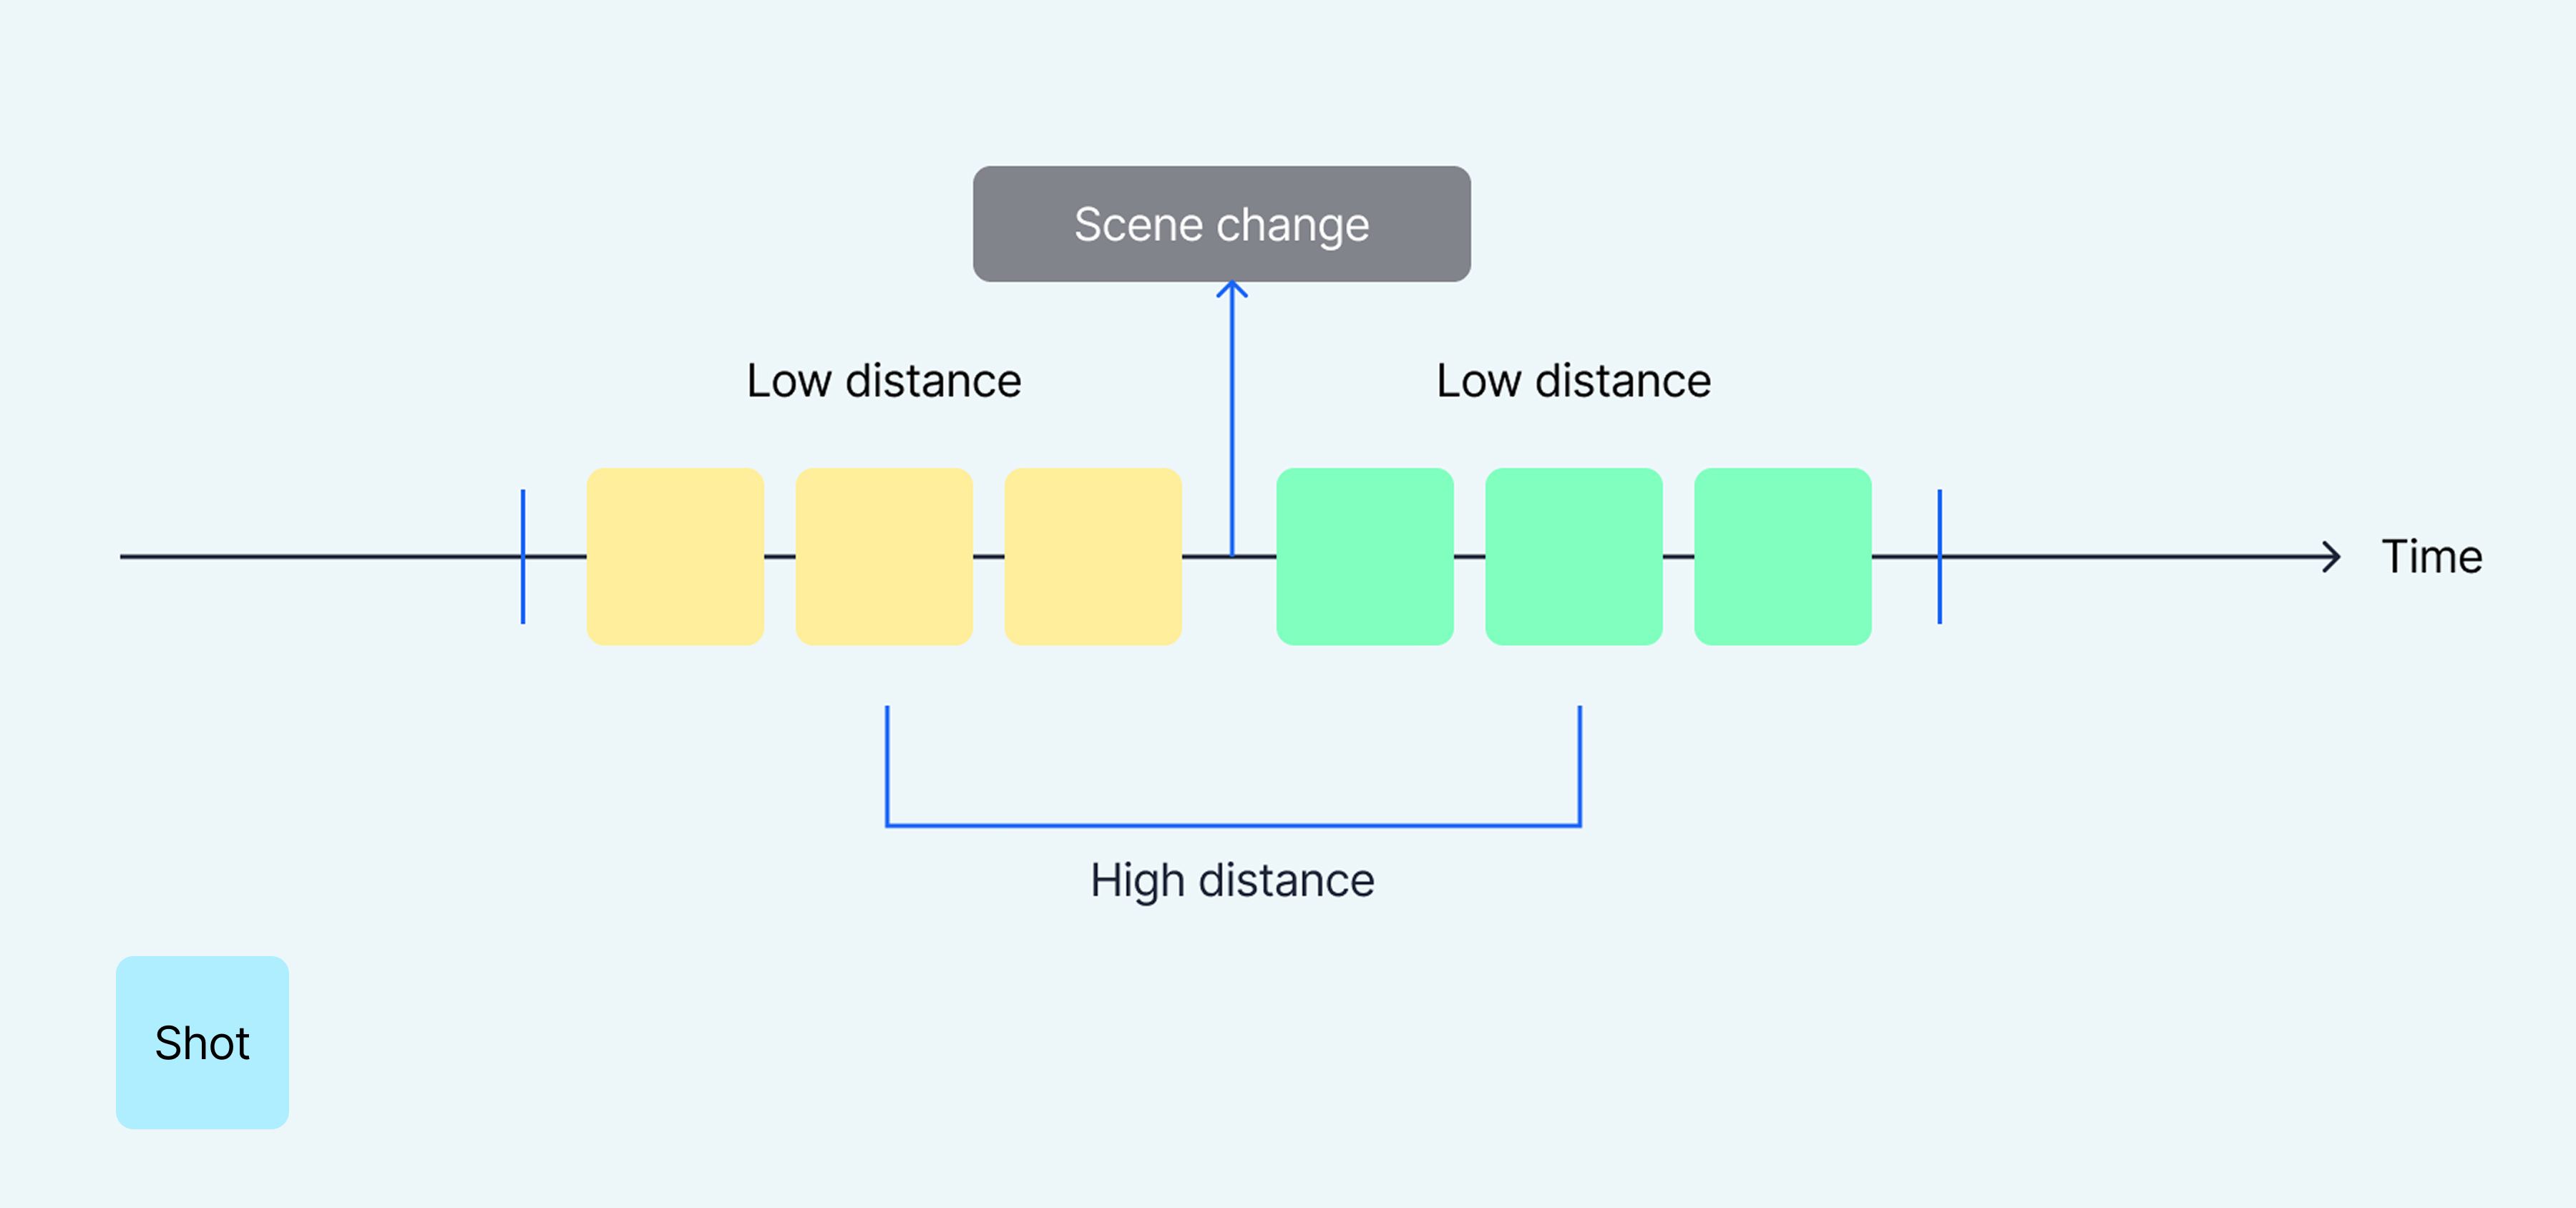
Figure 4: Scoring function - A high score is achieved when (a) shots before the scene change point are similar, (b) shots after the scene change point are similar, and (c) shots before and after the scene change point are dissimilar
We do not just select top-K highest scoring scene boundaries, as this could place two ad breaks too close together. To enforce the strict constraint that two ads are M minutes apart and still select the high score scene boundaries, we use binary search. This process is illustrated in Animation 4.
Animation 4: Optimisation - The algorithm acts as a scanner sweeping across the timeline, dynamically raising and lowering a target score to cherry-pick the top K ad breaks while strictly enforcing a minimum time gap between them
Validation on a large dataset
To validate the pipeline, we generated hundreds of candidate ad breaks across a diverse set of films and classified them as either “viable” (natural or near-natural transitions) or “wrong” (disruptive interruptions). The results were highly encouraging, with the vast majority of placements falling into the viable category. A key improvement came from incorporating audio embeddings, which significantly reduced awkward interruptions during continuous dialogue, even when rapid camera shifts occurred.
To bring this capability into production, we built an interactive platform around the pipeline. Publishers can upload content and immediately visualize suggested ad breaks along a timeline. Editors can approve strong boundaries, reject poor ones, and add custom annotations, creating a continuous feedback loop that steadily improves the system’s performance and contextual understanding over time.
References
[2]: Daniel Rotman, Dror Porat, Gal Ashour, and Udi Barzelay. 2018. Optimally Grouped Deep Features Using Normalized Cost for Video Scene Detection. In Proceedings of the 2018 ACM on International Conference on Multimedia Retrieval (ICMR '18). Association for Computing Machinery, New York, NY, USA, 187–195. https://doi.org/10.1145/3206025.3206055